- Home
- Projects
Data projects
Analyses in Python and interactive dashboards: the question each one answers, the method and the data behind it.
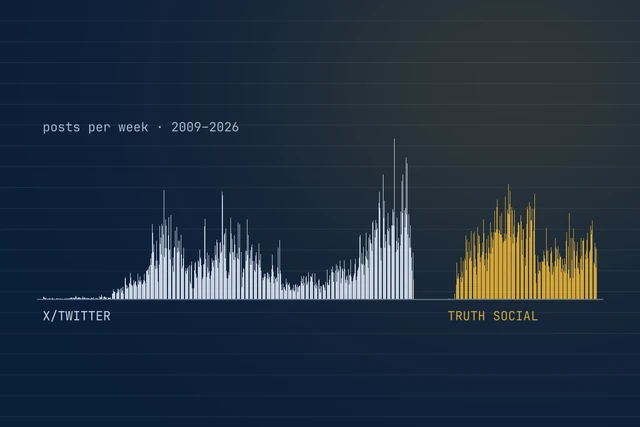 Python · NLP · BERTopic · RoBERTaSemantic Analysis of Donald Trump's PostsTemporal, textual and thematic patterns in Donald Trump's posts on X/Twitter and Truth Social from 2009 to 2026, with a topic model chosen by metrics and a validated sentiment score for every post.See project →
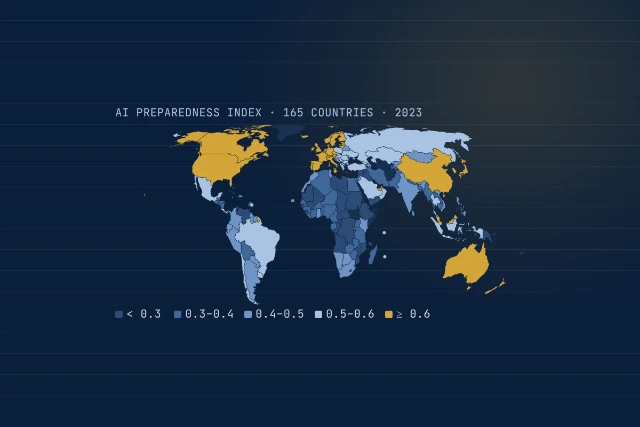 Power BI · InteractiveArtificial Intelligence Preparedness Index DashboardHow prepared are countries to adopt, develop and scale artificial intelligence? An interactive dashboard of the AI Preparedness Index (AIPI) by region and income level.See project →
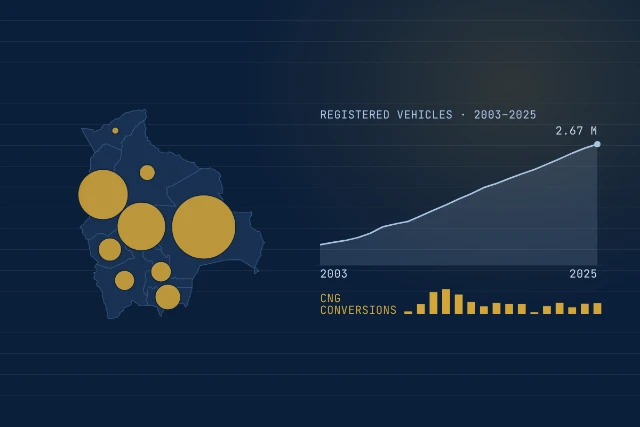 Power BI · InteractiveBolivia Vehicle Fleet DashboardHow has Bolivia's vehicle fleet grown since 2003, and how far has the conversion to compressed natural gas (CNG) spread? An interactive dashboard with filters by year, department and vehicle type.See project →